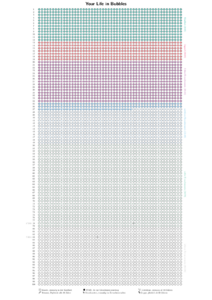
Lebenskalender
7. Januar 2022
Ursprünglich wollte ich mir eine parametrierbare tex-Datei erstellen.
Dazu hätte es nur ein paar Stellen mit Vergleichen (counter < limit) gebraucht, aber das habe ich mit dem ifthen Paket nicht hinbekommen.
Um nicht noch mehr Zeit zu verblödeln, ging ich dann den Umweg über ein quick&dirty Pythonskript.
Es fordert zwei Parameter, den Geburtstag (JJJJ-MM-TT) und die Farbwahl (black oder color), und mit einem optionalen dritten dem heutigen Datum (JJJJ-MM-TT) können Ausdrucke für ein zukunftiges Datum erstellt werden.
#!/usr/bin/env python3
# -*- coding: utf-8 -*-

import sys, math
from datetime import datetime, date

#source: https://www-genesis.destatis.de/genesis/online?sequenz=tabelleErgebnis&selectionname=12621-0002&zeitscheiben=16&sachmerkmal=ALT577&sachschluessel=ALTVOLL000,ALTVOLL020,ALTVOLL040,ALTVOLL060,ALTVOLL065,ALTVOLL080#abreadcrumb
lifeex_male = 78.64
lifeex_female = 83.4

male_week, male_year = math.modf(lifeex_male)
female_week, female_year = math.modf(lifeex_female)

#it's way easier to do the "math" by hand; valid values end with .0, .25, .5 or .75
male_week = 17.0
male_year = (male_year-1)/2
female_week = 10.5
female_year = (female_year-1)/2

def header():
    print(r'''\documentclass[12pt]{scrartcl} % 11pt font size

\usepackage[utf8]{inputenc} % Required for inputting international characters
\usepackage[T1]{fontenc} % Output font encoding for international characters

%\usepackage[margin=0pt, landscape]{geometry} % Page margins and orientation
\usepackage[paper=a2paper, margin=12pt, portrait]{geometry} % Page margins and orientation

\usepackage{wasysym} % \mars, \female
\usepackage{graphicx} % Required for including images
\usepackage[dvipsnames]{xcolor} % Required for color customization

\usepackage{url} % Required for the \url command to easily display URLs
\usepackage[ % This block contains information used to annotate the PDF
colorlinks=false,
pdftitle={Your Life in Bubbles},
pdfauthor={Thorsten Spätling},
%pdfsubject={Showing your life span with a circle for every week},
%pdfkeywords={Life representation, bubbles}
]{hyperref}

\usepackage{tikz}
\usepackage{lmodern}
%\renewcommand{\familydefault}{\sfdefault}

\setlength{\unitlength}{1mm} % Set the length that numerical units are measured in
\setlength{\parindent}{0pt} % Stop paragraph indentation

%----------------------------------------------------------------------------------------

\begin{document}
\centering
{
\fontfamily{lmss}\selectfont
\begin{Huge}
\textbf{Your Life in Bubbles} % Title
\end{Huge}\\[1em]
}
\begin{tikzpicture}[scale=1.1]
''')
def footer(colors):
    print('''
\\node[rectangle,rotate=270,text='''+colors[0]+'''] at (26.25,-2.75) {Kindheit (0-12)};
\\node[draw=none,fill=none,rotate=270,text='''+colors[1]+'''] at (26.25,-7.5) {Jugend (13-19)};
\\node[draw=none,fill=none,rotate=270,text='''+colors[2]+'''] at (26.25,-13) {frühes Erwachsensein (20-34)};
\\node[draw=none,fill=none,rotate=270,text='''+colors[3]+'''] at (26.25,-20.5) {mittleres Erwachsensein (35-49)};
\\node[draw=none,fill=none,rotate=270,text='''+colors[4]+'''] at (26.25,-31.5) {reifes Erwachsensein (50-79)};
\\node[draw=none,fill=none,rotate=270,text='''+colors[5]+'''] at (26.25,-44.75) {höheres Erwachsensein (80-100)};

\\node[draw=none,fill=none,text=black,align=left] at (4,-50.5) {\parbox{9cm}{\includegraphics[height=12pt]{measles.pdf} Masern, einmalig in der Kindheit}};
\\node[draw=none,fill=none,text=black,align=left] at (4,-51) {\parbox{9cm}{\includegraphics[height=12pt]{band-aid.pdf} Tetanus, Diphterie alle 10 Jahre}};
\\node[draw=none,fill=none,text=black,align=left] at (12,-50.5) {\parbox{9cm}{\includegraphics[height=12pt]{fsme.pdf} FSME, 3x zur Grundimmunisierung}};
\\node[draw=none,fill=none,text=black,align=left] at (12,-51) {\parbox{9cm}{\includegraphics[height=12pt]{pertussis.pdf} Keuchhusten, einmalig im Erwachsenenalter}};
\\node[draw=none,fill=none,text=black,align=left] at (22,-50.5) {\parbox{9cm}{\includegraphics[height=12pt]{herpes-zoster.pdf} Gürtelrose, einmalig ab 60 Jahren}};
\\node[draw=none,fill=none,text=black,align=left] at (22,-51) {\parbox{9cm}{\includegraphics[height=12pt]{influenza.pdf} Grippe, jährlich ab 60 Jahren}};
\\end{tikzpicture}
\\end{document}
''')

def bubbleline(color,xval,yval):
    print("\\node[circle,draw,fill=%s] at (%.1f, %.1f) {};" % (color,xval,yval) )

blackAndWhite = ["black", "black", "black", "black", "black", "black", "gray"]
colorful = ["JungleGreen", "OrangeRed", "Mulberry", "CornflowerBlue", "SeaGreen", "lightgray", "gray"]

if len(sys.argv) != 3 and len(sys.argv) != 4:
    print("usage: %s birthday (e.g. 1984-03-17) black/color [today]" % sys.argv[0])
    exit(1)

birthday = datetime.strptime(sys.argv[1], '%Y-%m-%d')
today = date.today()

if len(sys.argv) == 4:
    today = datetime.strptime(sys.argv[3], '%Y-%m-%d')

colors = []
if sys.argv[2] == "black":
    colors = blackAndWhite
else:
    colors = colorful

header()

total = 52*100
bday = int( today.isocalendar()[1] - birthday.isocalendar()[1] + (today.year - birthday.year -1)*52 )
#print(bday)
bubble = 0
while bubble < total:
    xval = float(bubble%52)/2
    yval = (-float(int(bubble/52))/2)
    if bubble < 52*12:#childhood
        if bubble < bday:
            bubbleline(colors[0]+"!50",xval,yval)
        else:
            bubbleline(colors[0]+"!10",xval,yval)
    elif bubble < 52*19:#youth
        if bubble < bday:
            bubbleline(colors[1]+"!50",xval,yval)
        else:
            bubbleline(colors[1]+"!10",xval,yval)
    elif bubble < 52*34:#early adulthood
        if bubble < bday:
            bubbleline(colors[2]+"!50",xval,yval)
        else:
            bubbleline(colors[2]+"!10",xval,yval)
    elif bubble < 52*49:#average adulthood
        if bubble < bday:
            bubbleline(colors[3]+"!50",xval,yval)
        else:
            bubbleline(colors[3]+"!10",xval,yval)
    elif bubble < 52*79:#mature adulthood
        if bubble < bday:
            bubbleline(colors[4]+"!50",xval,yval)
        else:
            bubbleline(colors[4]+"!10",xval,yval)
    else:#higher adulthood
        if bubble < bday:
            bubbleline(colors[5],xval,yval)
        else:
            bubbleline(colors[5]+"!10",xval,yval)
    bubble = bubble+1

counter = 0
while counter < 100:
    print("\\node[circle,draw=none,fill=none] at (%.1f, %.1f) {%d};" % (-1.0,(-float(counter)/2),counter+1) )
    counter = counter+1
print("\\node[circle,draw=none,fill=none] at (%.1f,-%.1f) {\\mars};" % (male_week,male_year))
print("\\node[circle] at (%.1f,-%.1f) {\\female};" % (female_week,female_year))
print("\\node[draw=none,fill=none,text="+colors[6]+"] at (-2.25,-%.1f) {\\mars};" % (male_year))
print("\\node[draw=none,fill=none,text="+colors[6]+"] at (-1.75,-%.1f) {%.1f};" % (male_year,lifeex_male))
print("\\node[draw=none,fill=none,text="+colors[6]+"] at (-2.25,-%.1f) {\\female};" % (female_year))
print("\\node[draw=none,fill=none,text="+colors[6]+"] at (-1.75,-%.1f) {%.1f};" % (female_year,lifeex_female))

footer(colors)
Beispielhafte Aufrufe sehen wie folgt aus.
$ ./bubbles.py 1960-10-13 color > Bob_heute.tex && pdflatex Bob_heute.tex
oder
$ ./bubbles.py 1964-05-08 black 2022-05-08 > Alice_Geburtstag.tex && pdflatex Alice_Geburtstag.tex
Inspiriert hat mich kurzgesagt, allerdings ist deren Poster mit 51,1 × 99 cm größer als meine DIN A2 Version mit 42 × 59,4 cm.